Career Data Charts
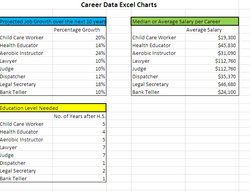
In this assignment we had to take the data that we had previously collected about future career choices and organize it and create charts and graphs that are going to help us fine easier ways to make a decision on which career we would like to pursue. The technology skills we needed were how to organize data and how to use specific data to create helpful charts. By creating this piece of work I learned that there are easier ways to use excel that are useful in your life and makes it simpler to plan for better and safer options for the future. In this assignment what I did well was knowing what data was needed in each chart and how to organize each chart clearly. Something I could have done differently was making the charts look more presentable.
Judge Glog
In this assignment we had to take previous information we had already acquired and put it in a glog that we created. The technology skills needed to complete this project is knowing how to use glogster to create an effective glog. What I learned by creating this is how to find ways to effectively get across information in an entertaining way. What I did well in this assignment is made my glog visually appealing to make people want to read about it. What I could have done better was used more brightly attracting colors.
Course Relfections
From taking this course I learned a lot about using multimedia. When we used out SMART phones to shoot videos, we learned about simpler ways to create short movies and presentations. In the future when you go to college or during your job, it could be easier to make and show presentations in a fun and better way. Learning things on how to use multimedia in these ways can also lead to other learning ways.
